
We recently included a new (and much simpler) way of using data parameters to draw statistical graphs. You can now use parameters in statistical graphs using formulas.
For example, if you create a data parameter using randnormal…
$p = randnormal(50,10,25)
This will create a data parameter containing 25 values which come from a normally distributed population with a mean of 50 and a standard deviation of 10.
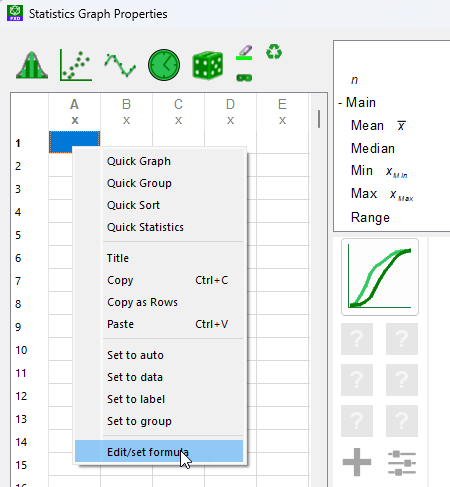
We can use this data parameter in a statistical graph by going to a cell in a column and right-clicking – then choosing Edit/Set Formula
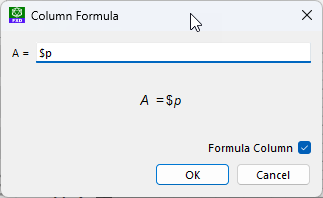
The formula window will appear and we enter $p
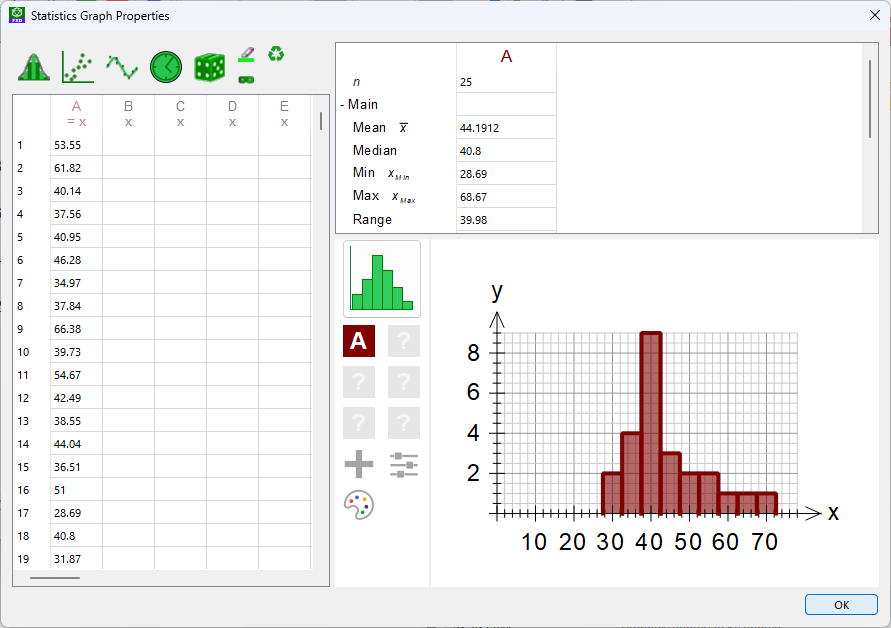
The data in $p will fill column A and can then be used to draw a graph. The data will be updated every time we regenerate.

Discover more from Efofex News
Subscribe to get the latest posts sent to your email.
