
We sometimes receive reports that FX Stat is “doing something wrong”. Often the problems are actually a symptom of a deeper issue – when is data discrete and when is it continuous?
Sometimes data is CLEARLY discrete in nature. Those cases are simple and we will not look at them.
Sometimes data is CLEARLY continuous and needs to be graphed appropriately. Again, this is easy.

Sometimes things are not so clear. For example here is some data that is not clearly discrete or continuous. Unfortunately, it is almost identical to the first data set! Certainly the histogram will be the same.
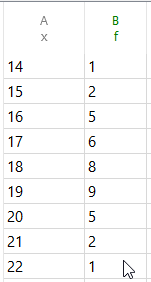
Is this data discrete? Should we graph it using a dot plot? Or is it “sort” of continuous so a histogram is fine?
Often the answer to these questions depends on the context of the data, but our products (obviously) have problems with context. On the whole, we do not get involved. If you decide to graph it as a dot plot or a histogram, our products will do as they are told.
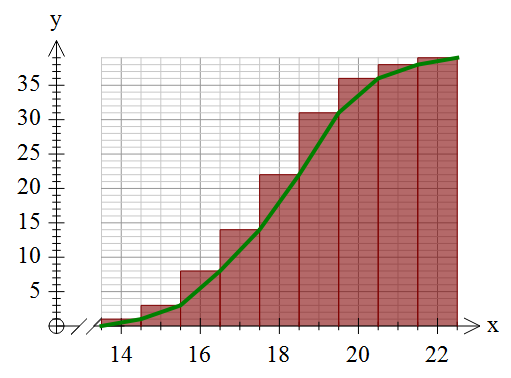
The real problem comes with ogives. If you are thinking of this data as “discrete”, the ogive should look like this (we have put in the histogram so you can see what we mean.)

Many of you are probably saying “but that is wrong – it should look like the first graph”.
Well … it depends.
If you are intending the data to be discrete, then this ogive makes perfect sense – by the time you get to 16 (as opposed to 16.5), your cumulative frequency is 8. If you are thinking of this data as continuous then you need the first graph.
Unfortunately, we cannot tell what you are thinking or, sometimes more importantly, which school system you are teaching in. Different school systems have different “standards”.
We have taken the decision to make our products treat the data as entered. If you enter discrete values with a frequency we will always draw the second, offset ogive. If you really mean your data to be continuous and want to draw the ogive, you will need to enter your data as groups.
Discover more from Efofex News
Subscribe to get the latest posts sent to your email.

I’d like the discrete versus continuous decision to be made by a checkbox or something. That way the user knows what the computer is thinking. It is a reasonable shortcut to enter 11, 12, 13 etc for continuous data instead of having to be explicit about groups. The groups can be implied by the data entry and the checkbox.
Thanks for the comment Gavin!
While I totally agree with you in principle, in practice this may not be ideal. The problem with this solution is that it adds “something else” for users to decide and for us to explain. Given that FX Stat is such a complicated beast already, that is not always ideal. In fact designing a user interface that allows sufficient power without overwhelming complexity is usually our biggest challenge, particularly in statistics where there is quite a lot of variation as to what is the “right” way to do things in various parts of the world.
Now that our move to the cloud is complete, we are going to be looking at a revamp of the user interface for both FX Graph and FX Stat. We might be able to work in your suggestion at that point.