
The latest versions of FX Draw (V7.003.7) and FX Stat (V4.003.3) include the ability to graph a box and whisker plot using just a 5 point summary.
By default, if you graph a data set which includes exactly 5 data points, our products will interpret those 5 data points as a 5-point summary.

Note that the five points do not need to be in order. In this case, the 25 and 32 are reversed.
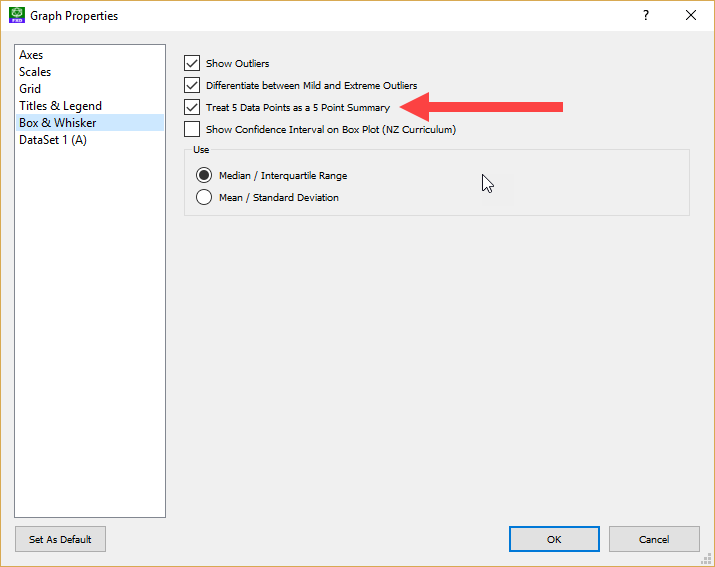
The new feature can be turned off in the box plot options but we anticipate that this will rarely happen as the point of a box plot is to summarise a large data set. Most teachers would never even contemplate creating a box plot for just five data points.
The new feature is available now and will make drawing box plots that bit simpler. The feature is yet another user suggested option. Thanks Charlton!
Video – Drawing Box Plots Using a 5 Point Summary
Discover more from Efofex News
Subscribe to get the latest posts sent to your email.

Pingback: Lots Of Videos | Efofex News