
You have always been able to change the colors of functions and statistics graphs – but it has always been a bit slow and fiddly. Each function or data set needed to be changed individually which was slow and error prone.
In the latest versions (19.05.27), we have added the ability to quickly change ALL of the functions or data sets.
Function Graphs
The quick entry screen for functions has seen two changes. Firstly, any changes made to line widths or point sizes now affect ALL functions. You can, for example, set all function lines to 2pt with one change.
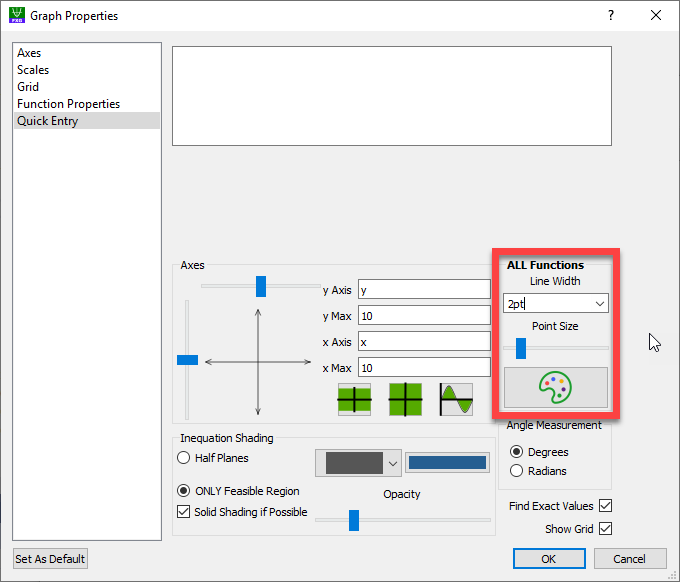
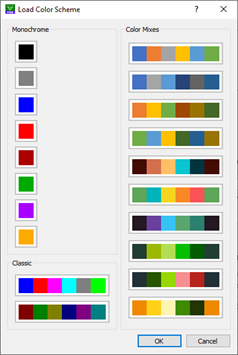
The second change is the addition of a palette button. Pressing this allows you to change the color settings of all function lines. You have the choice of setting all functions to one color (normally black) or to choose one of twelve different color schemes, including the “classic” color palettes. Once you have chosen a color palette, pressing Set As Default will keep your current settings for all future graphs.

If you wish to change the color or line width of an individual line, you now need to change to the Function Properties tab.
Statistics Graphs
We have also added color schemes to statistics graphs.
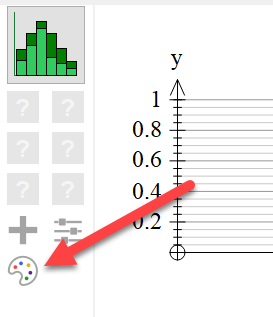
The colors of individual data sets can be changed by pressing the data set buttons.
You can find a short video of the new feature at https://youtu.be/eyOVZiF7TXg
Discover more from Efofex News
Subscribe to get the latest posts sent to your email.
