
Due to the topic’s inclusion into the IB program, we have added Voronoi diagrams to FX Draw and FX Graph. This new feature has been included into software releases dated after November 5 2020.
If you do not know of Voronoi diagrams, you can find more information here.
https://en.wikipedia.org/wiki/Voronoi_diagram
Note that we only implement the Euclidean distance version of Voronoi diagrams.
Even if you do not teach the IB course, Voronoi diagrams are a fertile source of ideas for investigative activities related to coordinate geometry.
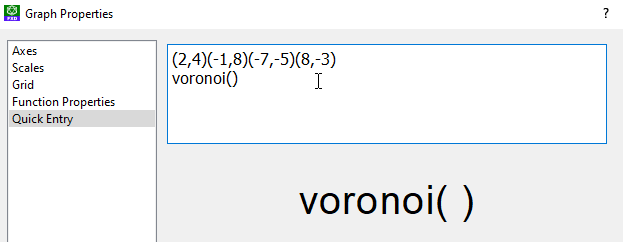
Using Voronoi diagrams is easy.
- Create a graph.
- On the quick entry screen, type any fixed points you want to include in the diagram.
- Make the final function line Voronoi()
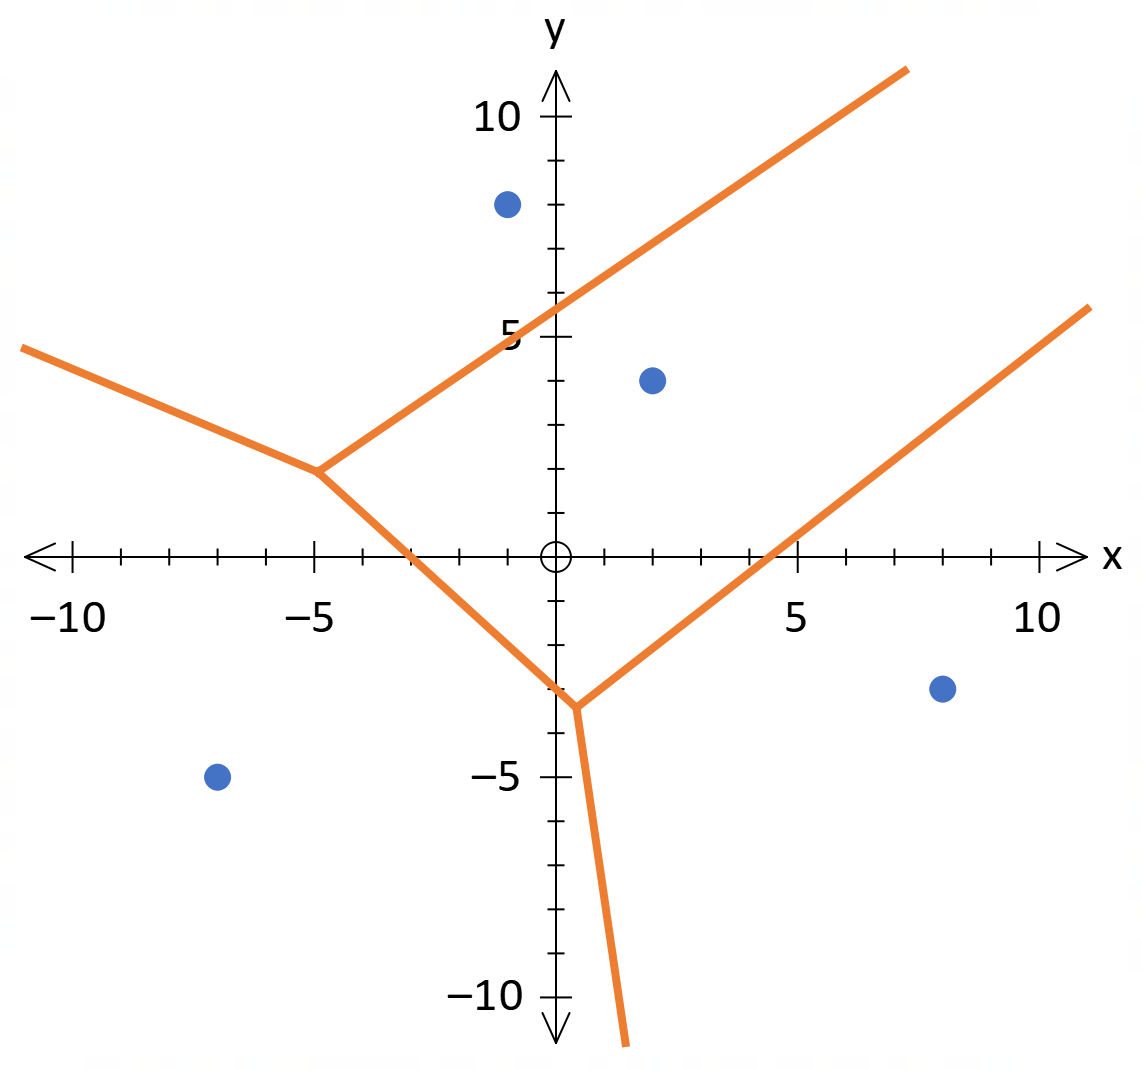
4. When you return to FX Draw, the Voronoi diagram will be automatically drawn.
Now you can select the marked point tool and add more points. The diagram will be redrawn interactively.

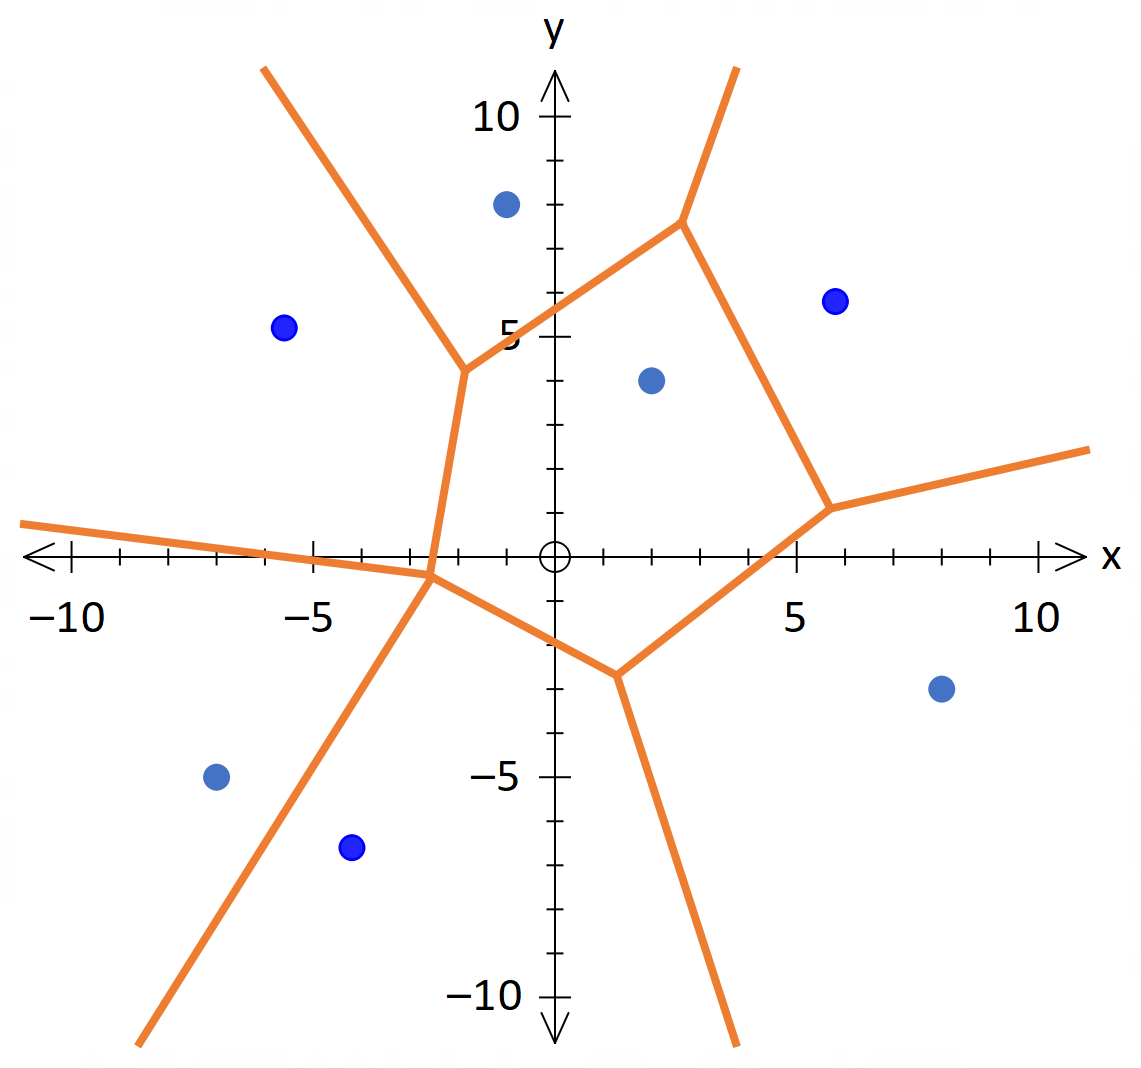
Marked Points are versatile as you can select and move them dynamically.
Thanks to MM from Pembroke in South Australia for the suggestion!
Discover more from Efofex News
Subscribe to get the latest posts sent to your email.
