
We have added a new sinusoidal data generator and regression calculation to FX Stat and FX Draw. They have been included in the latest uploads.
Data Generator
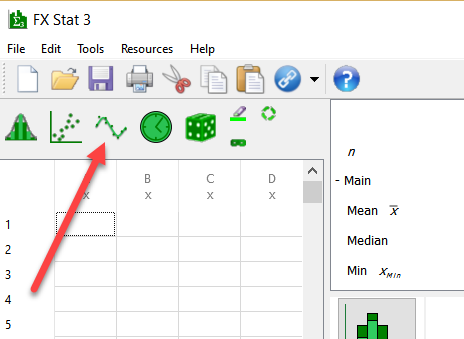
The new data generator is available from the data generator toolbar.
Simply enter the parameters you wish FX Stat/FX Draw to use for the sine curve, select an amount of “noise” to add to the data and push OK.
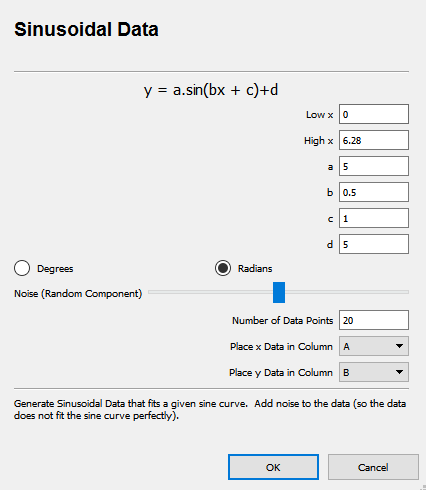
A bivariate data set is produced that can be graphed on a scattergraph.

At the moment, FX Stat is trying to fit a linear regression equation to the data (not very successfully!) By right clicking on the graph, we can change the regression equation in use.
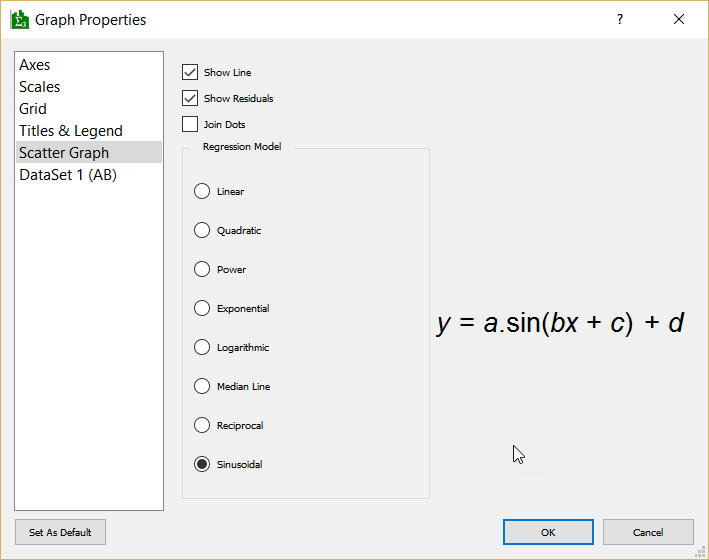
By selecting Sinusoidal Regression, FX Stat will fit a sine curve to the data.

The summary statistics pane will offer you a number of versions of the curve’s equation.
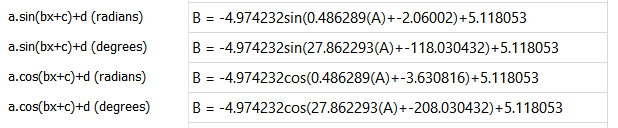
All of these equations are equivalent.
Please note that the calculation of sinusoidal regression equations is not as simple as other regression equations and there are always a number of possible solutions. FX Stat/FX Draw will produce an equation with the longest possible cycle-length (you could, for example, produce a sine curve with a far shorter period than the one shown above that actually “fits” the data better) and the results are similar to those produced using other tools like graphics calculators. There are some cases however, particularly if you have multiple cycles worth of data, where FX Stat/FX Draw may find a solution you were not expecting.
Discover more from Efofex News
Subscribe to get the latest posts sent to your email.
