Coming Soon – FX Draw 6 Beta!

We have just about finished initial development of FX Draw 6 and you will be able to download a beta soon!

FX Draw 6 is an exciting extension of FX Draw’s capabilities allowing you, for the first time, to work in 3D.

What’s New?

· FX Draw 6 will include the 3D graphing engine that we have implemented for FX Graph 6. This lets you graph relationships in 3 dimensions and provide graphic demonstrations of things like volumes of solids of revolution and intersections of planes. You might notice that the planes are slightly transparent, allowing your students to get a better idea of what is going on.

· FX Draw 6 will also add galleries of 3D objects that can be rotated and shaded exactly as you desire. The objects can also display hidden edges as shown below.

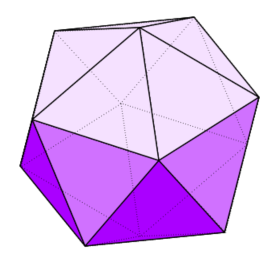
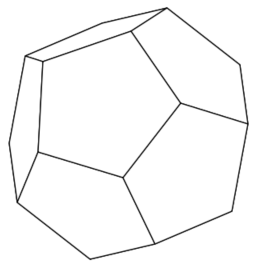
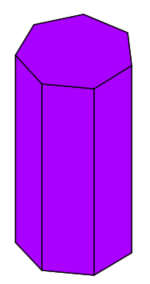
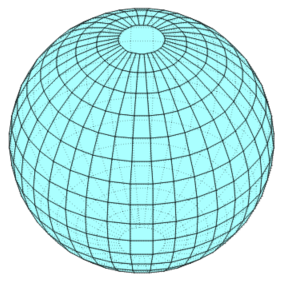
FX Draw 6 will come with galleries of dozens (hundreds?) of 3D objects.

· We have also implemented a dimensioning tool. This allows you to quickly add dimensions to any image.

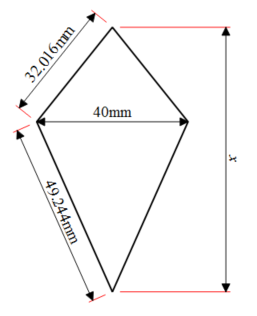
The dimensions are all scaled using a global scaling factor. In the above example, we have changed the global scaling from 1:1 to 1:5 and all dimensions have been scaled accordingly. You can also replaced the measured distance with any text. This combination of features makes drawing scale diagrams trivial.

· FX Draw 6 also implements a “4 point” line tool that permits you to draw diagrams where lines extend beyond the points which define their direction.

Notice that the selected line has four control squares. A and B define the direction of the line. C and D define the end points.

· We have also greatly improved the default line system allowing you to create lines that use the current defaults whilst using any of the six line tools, rather than just the line defined by end points.

· Obviously we have also worked to remove faults and improve the usability of tools.

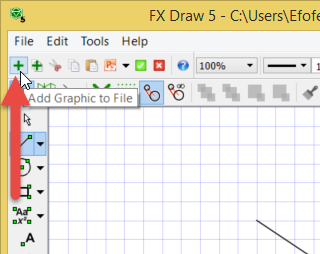
Most importantly, we have made almost no changes to the user interface of FX Draw 5. We know that teachers are extremely time poor and do not want to learn a new interface, so we have continued to leave things alone. Using FX Draw 6 feels almost exactly the same as using FX Draw 5, you can just do more!

Keep and eye out for the beta!

Posted in Uncategorized | Tagged , | Leave a comment

FX Graph 6 Beta 3 Uploaded

We have uploaded a new version of the FX Graph 6 Beta. This beta will run until October 31.

Initial responses to FX Graph 6 have been positive with few errors found. We will soon be moving FX Graph to release status and this is your last chance to have a say!

FX Graph 6 (Windows) August 1 2015 Download
FX Graph 6 (Mac) August 1 2015 Download

Don’t forget the great new features like volumes of solids of revolution. The ability to animate the creation of the volume is most useful.

Volumes of Rotation

Just don’t forget to tell us about anything you find. Send your feedback to info

Posted in Uncategorized | Tagged , | Leave a comment

Rotating 3D Axes in FX Graph 6

We have been asked why you cannot rotate the 3D axes in FX Graph 6 using the mouse. We did experiment with mouse-rotation but found, as we have found with all other 3D graphing implementation, that the result was very difficult to control. When we moved the mouse “something” happened, but not necessarily what we intended. We also decided to let you use the mouse to translate the axes around the page. This conflicted with the use of the mouse to rotate the axes.

What we decided on was:

1. The mouse will translate the axes.
2. The mouse wheel (if fitted) will zoom into and out from the origin.
3. You can rotate the axes using the x, y and z keys. Holding down Shift reverses the rotation.
4. You can use the toolbar to align the axes and start auto-rotations.

As with every thing else, we are interested in your feedback on this. Send feedback to info

Posted in Uncategorized | Tagged , | Leave a comment

FX Graph 6 Beta 2 Uploaded

FX Graph 6 Beta 2 Uploaded
A big thank you to those users who have taken the time to test the new FX Graph 6. They have definitely found some errors (which is the whole point really!) but the comments we have received indicate that this is a great upgrade. If you have the time to take a short look, we would love you to download the latest beta.

FX Graph 6 (Windows) June 15 2015 Download
FX Graph 6 (Mac) June 15 2015 Download

One of the most popular new features is the volumes of solids of revolution. The ability to animate the creation of the volume is most useful.

image

image

Just don’t forget to tell us about anything you find. Send your feedback to info@efofex.com

Posted in Uncategorized | Tagged , | Leave a comment

Efofex Invited To Harvard

Last week we got to see FX Bridge in Perth. This week, Efofex has been invited to Harvard!

OK, that’s a slight exaggeration.

Harvard has asked us to provide software under our EmPower program for one of their students.


It also provides us with another chance to remind you of our EmPower program for students with special needs. FX Equation, in particular, is so simple to use with a keyboard that it provides an ideal opportunity for students who find writing mathematics difficult. We have provided free software to nearly 2000 students all over the world and have a number of college graduates who credit FX Equation with allowing them to pursue their dreams.

If you have students at your school who are having trouble with the physical side of writing mathematics, please consider looking at the EmPower program. Experience shows that it can change lives.

Posted in Uncategorized | Tagged , | Leave a comment

Why Is My Text Red? / Why Aren’t My Equations Lining Up?

Question:

Why is My Text Red? OR Why Aren’t My Equations Lining Up in Word?

Answer:

When an FX Equation equation is inserted, it is inserted as a space, then the equation, then another space.

The equation between the two spaces is lowered to line up with where the text is.

Why the spaces? Because of a little quirk in Word. If you manage to get your cursor in between the equation and the space, any text you type will be lowered (quite dramatically). This looks something like this

Unfortunately, compared to the next text, the equations look as if they need to be lowered. Our macros set the text colour for this new text to bright red to make sure that you realise that you are in the wrong spot. If you see red, STOP and move the cursor to the other side of the space.

What sometimes happens is that users see the red text and change the colour back to black. Unfortunately ALL of the subsequent text that they type will be “lowered”. The equations will look like they are high where, in fact, it is the text that is too low.

You can reset the position of the text by selecting the text and going here…

but it is MUCH better to just never get the text lowered.

The best way to understand this behaviour is to have a bit of a play around with it. Try typing on either side of the space to get a feel for what is going on. We have found that customers do not have a problem with it once they understand it.

Posted in Equation | Tagged | Leave a comment

How Do I Get Rid of The X’s That Are Added To My Flood Fills?

Question:
Whenever I use the flood fill tool, I get unsightly X’s added to the graphic. How do I get rid of them?

Answer:

The short answer is that you don’t get rid of them. They are part of FX Draw’s control system. They do not, however, show up on any generated graphics. You will only see them inside FX Draw while you are creating your graphic. The generated graphic has no X marks. It also removes other control elements like the grid.

Posted in Draw | Tagged , | Leave a comment

How Do We Update Efofex Products?

Question:

How Do We Update Efofex Products?

Answer:

There are two components to this question: checking for updates and installing updates.

Checking for Updates

Many software packages regularly “phone home” to check for updates. This can either be done by the program itself or by installing a separate “update checker” mini program that runs intermittently. Many computers have dozens of these mini update-checking programs running. Most update-checkers are well behaved but some are resource hogs or just buggy. Most schools do NOT want update-checkers running on their school computers as it can mean hundreds of computers running dozens of programs on a regular basis. This consumes bandwidth and any faults are dramatically amplified.

For this reason, we do NOT use update-checking programs. Our products check for themselves about once per week but only when they are run by the user. This minimises the impacts on systems but it does have a downside; the updates are reported by the program when it is running. If you try to download and install the update at that point of time, it will fail because you cannot update a running program. Just download the update to your computer and install it later, when the program is closed.

Many schools do not want ANY update checking to occur, so we give you the option to turn this behaviour off.

Even when checking for updates, the products do not report every update available. Many of our updates (and we can update products daily at times) address minor issues and inconveniences that affect very few people. As most of our users will not be affected by the changes, there is no point informing users of the change or forcing an update onto them. The programs will NOT report these updates to users. Only significant updates and upgrades are reported.

In summary, compared to most programs you might be using we inform you of updates infrequently and the checking will often be turned off. This is solely due to the environment that we operate in.

Installing Updates

Many software products automatically install updates, usually with your consent. We do NOT do this. Schools have told us loud and clear that they do not want this behaviour. They want to install software and updates on their own schedule. This makes life much simpler for school system administrators but does feel a little unnatural to users who expect software to update itself. While we would like to make it easier for users to keep their software up-to-date, we have decided to heed the demands of our customers and keep the process manual.

To install updates to our products you need to:

  1. Download the new version either because you have been informed of an update or because you have decided to install the latest version.
  2. Install the new version in exactly the same way you installed the initial version – straight over the top of the old version. You do NOT need to uninstall the previous version as all of our updates are designed to completely replace the old version.

It is probably a more manual process than you are used to but, again, this is due to the demands of our customers.

Getting the Latest Version

You can choose to turn on “Check for Updates” and wait for the products to tell you that there is an update available but you always have access to the latest versions from our downloads page.

Downloads Page

You don’t need to wait until you are told to go there, you can go any time you like.

  1. The latest version available and the date of its release
  2. A list of each version and the issues it addresses
  3. The download link

What We Recommend

  1. Turn on Check For Updates
  2. Download and install new updates whenever informed – more often if possible.
  3. If you do not want to turn on Check For Updates, install a new version AT LEAST ONCE PER YEAR – more often if possible. Schools using the FX MathPack subscription should schedule a new download every time they change their system image or input new registration details.
Posted in Chem, ChemStruct, Draw, Equation, Graph, Stat | Tagged , | Leave a comment

Perth Seminars Available

Moving Back To Perth – Training Opportunities
After seventeen years being based in country Western Australia, Efofex is moving back to Perth. We are currently building new premises in Claremont that will be ready early 2016 but in the short term we will be based in Crawley.

All this means that we will find it much easier to offer training courses in the Greater Perth area. If you need training in any of our products, send us an email at info and we can get things organised.

Posted in Uncategorized | Tagged , | Leave a comment

Using The Connection System with PowerPoint for Word

Question:

How Do I Use the Connection System with PowerPoint for Word?

Answer:

As recently announced on our news feed, PowerPoint has started having trouble using our products as OLE objects (our traditional double-click to edit system). Until Microsoft fixes the issue (unfortunately it is nothing to do with us), you might need to use the Connection system to get your graphics into PowerPoint.

The Connection System is basically a managed version of Copy and Paste where FX Draw, Graph or Stat store all the graphics for a PowerPoint presentation in one file located in the same location as the PowerPoint file.

1. Open your PowerPoint file and make sure it is saved somewhere. Our products use the PowerPoint file name to create an appropriate file name for their data.

2. Open the Efofex product, we will use FX Draw for this example.

3. In FX Draw, choose PowerPoint from the Connect list.

4. FX Draw will go into Connect mode and will save its diagrams in a file with a file name based on the PowerPoint file name. FX Draw will automatically manage this file – saving as it goes. The file will be stored in the same location as the PowerPoint file with and fxd extension added to the file name. Note the filmstrip at the bottom of the FX Draw page which allows you to select an image from the collection in the file.

5. Draw your diagram and press the green check mark. The image will be pasted into your PowerPoint presentation

6. To create a new diagram, press the Add Graphic to File button (or add a copy of the current graphic using the next button along)

7. To edit an existing diagram, select it and copy it to the clipboard. Then change focus to FX Draw. FX Draw will compare the graphic on the clipboard to the graphics it has on file and automatically select the best fit. After you have edited, click the green check mark and your graphic will be updated.

At all times, you are really just copying and pasting. The green tick and finding the right diagram in the file are just there to make things quicker. There is nothing to stop you copying and pasting all by yourself.

We have created a video showing the Connection system operating between FX Graph and Word. The principle remains the same however. You can view the video here.

Posted in Draw, Graph, Stat | Tagged , | Leave a comment