This new upload is a one sheet summary of all possible shadings of a two-circle Venn diagram, with the associated set statements.
These features have both been inspired by customer suggestions.
1. “UK Style” Polar Graphs
In some locations (at this point of time, we only know of this existing in the UK), negative results from functions such as r = 8sin 2th are ignored. This produces graphs like this.
FX Draw and FX Graph can now draw “UK Style” polar graphs. Go to the Tools menu and choose Preferences.
Check the “Restrict Polar to r >= 0” option.
At Efofex we try to accommodate all school systems. If you work in a location where something is done a little “differently” please feel free to contact us. We may be able to add a new option for you (or point you to an option that has always been there!)
2. Arrow Heads on Link Graphs.
Link graphs are a form of bivariate data graph available in the statistics graph tool.
You can now add arrow heads to the links.
This new feature was inspired by a question from an EmPower student.
In FX Draw you have always been able to overlay a set of axes with a freehand, smoothed line (but the resulting line is not “part” of the graph). There has not, however, been a way of drawing a smoothed line over an FX Graph graph.
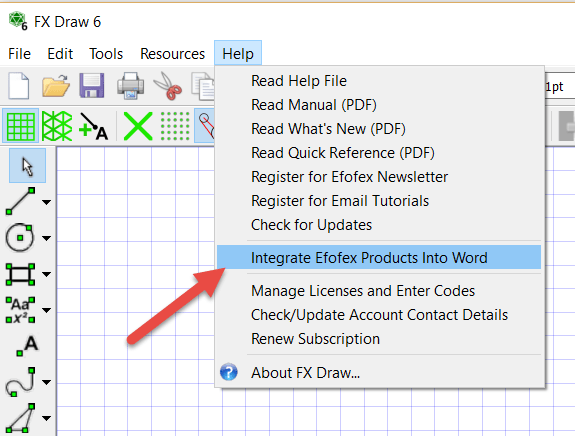
We have now added a new feature to both FX Draw and FX Graph that allows you to explicitly enter a smoothed line into the graph tool.
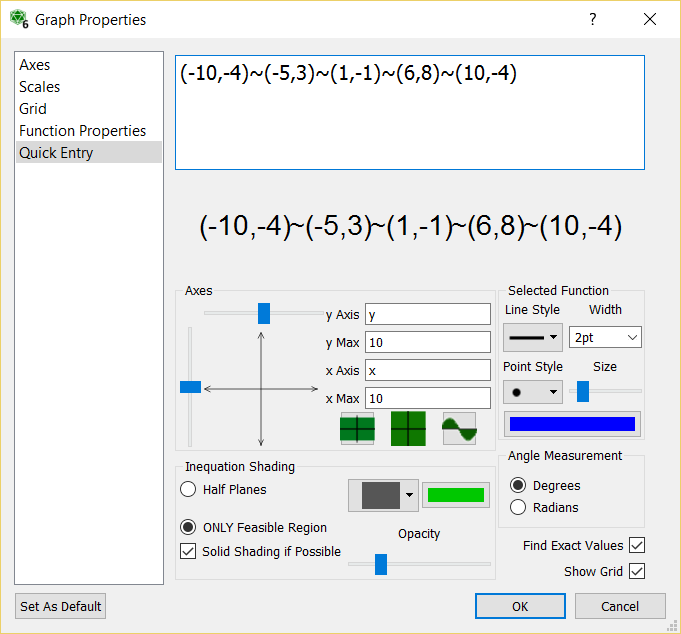
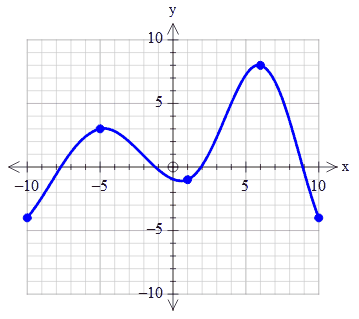
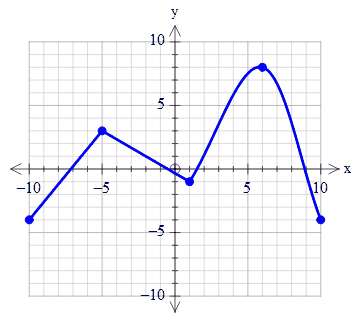
If you join points with a tilde (~), the graph tool will draw a smoothed line joining the points.
For example, if you enter (-10,-4)~(-5,3)~(1,-1)~(6,8)~(10,-4) as your function, the graph tool will draw this graph.
You can mix ~ and + in the same function.
(-10,-4)~(-5,3)+(1,-1)~(6,8)~(10,-4)
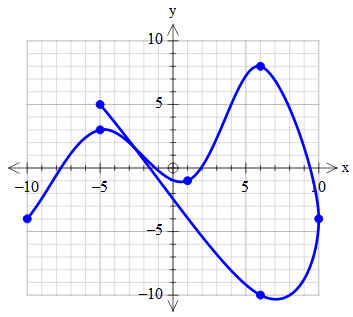
The smoothed curves do not have to be left to right. In other words, they do not need to represent a function.
(-10,-4)~(-5,3)~(1,-1)~(6,8)~(10,-4)~(6,-10)~(-5,5)
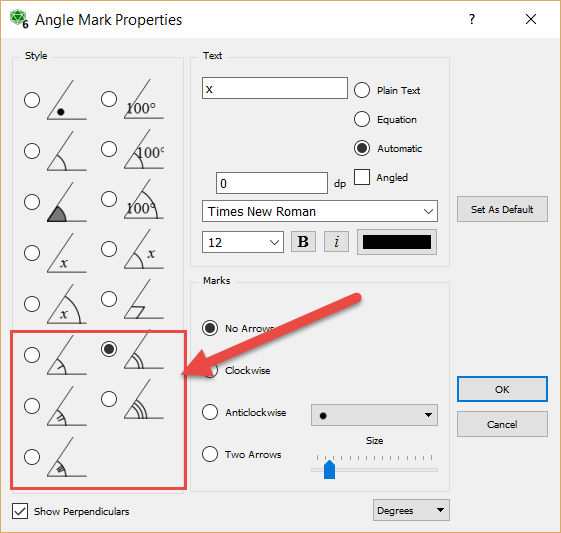
The resulting line is guaranteed to pass through the listed points. You can also reduce the size of the points so that they do not appear as marked points.
We are going to introduce the original Efofex Teacher Resource Project uploads to ensure that our customers have seen the resources we are making available.
The Bearings document contains four bearings questions that can modified for use in exams, tests and worksheets. They highlight the bearings tool available in FX Draw.
Current subscribers and license holders can download a docx version of the file that includes full solutions.
Recent changes in security for all recent versions of Windows, has forced a change in the way we integrate our products into Word.
Previously, you were offered a chance to integrate with Word as part of installation. You could also choose to integrate for All Users. The security changes have prevented us from offering the option to integrate for All Users in a reliable way (installing for just the current user is not usually useful in school situations) so we have been forced to change our systems.
Now each user integrates with Word individually. This is not as hard as it sounds.

Pressing Yes at this point is all that is required for a User to perform the integration.
If the user happens to choose No, they can always integrate later from the Help menu.

This can be done at any time and the new Word tab will show up the next time Word is started.
The good news is that this new process is far more resilient and can be actioned by the user. There is less likelihood that technical support will need to be involved.
This feature has been inspired by numerous user requests.
We are not entirely sure what name to give this new feature so we have called it “Use Alternative Axes”
First some context. There is a need in some school systems for a graph that is a Histogram but that doesn’t just have a scale on the x axis. This is particularly the case when the graphed data is integer amounts.
For example, for this data table…
| x | 0 | 1 | 2 | 3 | 4 | 5 | 6 | 7 | 8 | 9 | 10 |
| f | 3 | 2 | 5 | 6 | 8 | 9 | 6 | 7 | 4 | 2 | 1 |
Some users wanted to produce this

but FX Draw and FX Stat would only produce this

We have now added the ability to use the alternative axes style.

If you are graphing grouped data such as this data that is grouped into 0-5, 5-10 and so on, the alternative axes will mark the centre of the division – another commonly requested feature.

We have made renewing your subscription more flexible. Now, when ordering or renewing a subscription, you can choose a subscription length from 12 months to 36 months. This allows you to align your resubscription date with your school calendar.
You also now have the ability to attach four email addresses to a subscription.
1. Main Email Address
2. Technical Support Email Address
3. Accounts Email Address
4. Other Email Address
We will send appropriate emails to each address. This should make life easier for busy teachers as WE will remember to send emails to the right places!
We have uploaded a new Teacher Resource Project file – The Two Piece Puzzle
This activity provides the nets for a two piece 3D jigsaw puzzle. The two pieces fit together to form a tetrahedron but a surprising number of people find the puzzle quite difficult to do (it is obviously not too hard, there ARE only two pieces!)
This is another Efofex Teacher Resource Project inspired feature.
We have added a feature to FX Draw that allows you to adjust a line’s length and angle after creation. You have always been able to adjust a line visually but now you can explicitly set a line’s length and angle.
1. Draw a line using any of the line tools.
2. Right click on the line.
3. Adjust the length and/or angle.
4. Press OK.
We have uploaded a new Teacher Resource Project file – Quad Quandary.
Quad Quandary looks at optimising the area of a quadrilateral by changing the angle between two of the sides.
This requires the optimisation of this function.

The students are provided with some guidance in developing the formula for the situation but require knowledge of the cosine rule, the sine formula for area of a triangle and knowledge of inverse trigonometric functions. They will also require use of a graphics calculator or graphing program such as FX Graph in order to optimise the function.
The activity is designed to be done as a pre-test activity and then an in-class validation test but can be adapted to suit your needs.